Every workplace safety program generates incident data, but not all organizations know how to make the most of it. Incident reports, near-miss logs, and safety observations provide more than just numbers—they reveal patterns, highlight risks, and offer a roadmap for improvement.
The challenge lies in translating this raw data into clear, actionable insights that drive meaningful change. Without the right strategies, data can remain an untapped resource, leaving organizations reactive instead of proactive.
This guide explores how to analyze incident data effectively, identify trends, and use those insights to enhance workplace safety.
Why Incident Data Matters
Incident data isn’t just a record of what’s gone wrong—it’s a tool for understanding the “why” behind workplace risks. Every report contains valuable information about hazards, behaviors, and system failures that contribute to incidents. When analyzed effectively, this data helps organizations:
Identify Patterns
Highlight recurring risks and pinpoint high-risk areas, equipment, or processes.
Drive Preventive Measures
Use trends to implement targeted safety improvements before incidents escalate.
Support Compliance
Provide documentation that demonstrates a proactive approach to safety during audits.
Boost Accountability
Show clear links between safety initiatives and outcomes, reinforcing a culture of responsibility.
By leveraging incident data, safety managers can shift from reacting to problems to preventing them entirely.
Step 1: Collect Consistent, High-Quality Data
The foundation of actionable insights is reliable data. Inconsistent or incomplete incident reporting undermines your ability to draw meaningful conclusions.
Best Practices for Data Collection
Standardized Reporting Forms
Ensure every incident report includes key details such as date, time, location, individuals involved, and a clear description of the event.
Encourage Near-Miss Reporting
Near-misses are early warning signs of potential hazards. Make it easy and non-punitive for employees to report them.
Use Mobile Tools
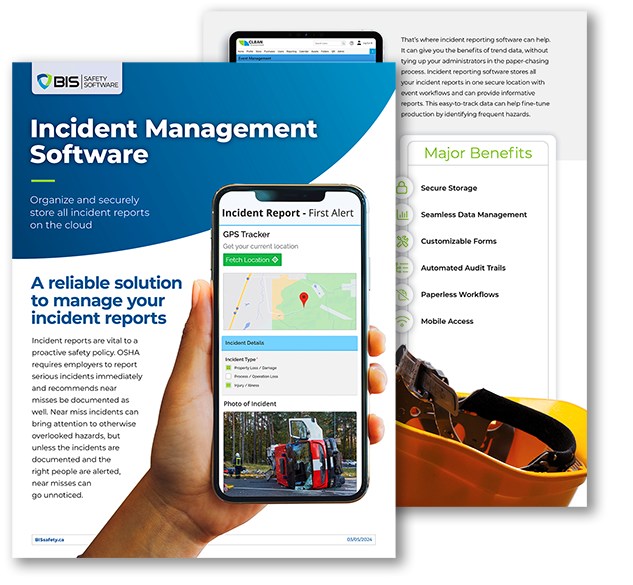
Digital reporting systems streamline data collection and reduce errors compared to paper-based processes.
Case Study: A logistics company implemented a mobile app for near-miss reporting. Within six months, reports increased by 40%, uncovering trends related to poorly marked loading zones. Addressing these issues reduced incidents by 25% the following quarter.
Step 2: Centralize and Organize Your Data
Scattered data creates blind spots. Consolidating all incident reports, safety observations, and inspection logs into a centralized system ensures nothing slips through the cracks.
How to Centralize Effectively
Use Safety Management Software
Platforms designed for workplace safety consolidate data into a single dashboard, making it easy to analyze trends.
Tag and Categorize Data
Organize reports by type, location, equipment, or contributing factors to identify recurring issues.
Integrate With Existing Systems
Ensure your safety software connects with HR, maintenance, and compliance platforms to provide a comprehensive view.
Pro Tip: Regularly review your data for completeness and consistency. Missing or inaccurate information can skew results and lead to flawed conclusions.
Step 3: Analyze for Patterns and Trends
Once your data is centralized, the next step is to identify patterns that point to underlying risks. Look for clusters of similar incidents or recurring hazards across locations.
What to Look For
Recurring Equipment Failures
Are specific machines or tools involved in multiple incidents?
Time-Based Trends
Do incidents spike during certain shifts or seasons?
Location-Specific Risks
Are certain areas of your facility more prone to hazards?
Example in Action: A manufacturing plant noticed a pattern of injuries involving workers replacing conveyor belts during peak shifts. The analysis revealed that time pressures led to shortcuts in safety procedures. By scheduling maintenance during slower periods and providing additional training, the company reduced injuries by 30%.
Step 4: Translate Insights Into Actionable Changes
Data is only as valuable as the actions it inspires. Once trends are identified, use them to implement targeted improvements.
Strategies for Acting on Insights
Revise Policies
Update safety protocols to address identified risks, such as enhanced procedures for high-risk tasks.
Targeted Training
Provide specific training sessions based on the most common incident types or contributing factors.
Engineering Controls
Modify equipment, tools, or workspaces to eliminate hazards entirely.
Case Study: A construction company analyzed incident reports and found that ladder-related falls were a recurring issue. They introduced new ladder inspection protocols, provided hands-on training, and replaced aging equipment. The result? A 50% decrease in ladder-related injuries within a year.
Step 5: Share Insights With Your Team
Transparency is key to fostering a safety-first culture. Sharing insights from incident data helps employees understand risks and reinforces their role in creating a safer workplace.
How to Communicate Effectively
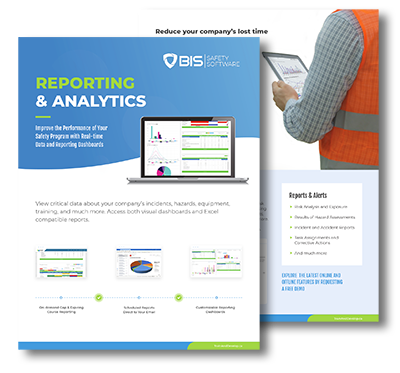
Visual Dashboards
Use charts, graphs, and heatmaps to make data easy to understand.
Regular Safety Meetings
Discuss trends and progress during team huddles or monthly safety reviews.
Highlight Successes
Celebrate reductions in incidents or near-misses to keep morale high and motivate continued participation.
Pro Tip: Frame discussions around “how we can improve” rather than assigning blame. A solutions-focused approach encourages openness and collaboration.

Step 6: Monitor and Measure Results
Implementing changes is only part of the process. Continuously monitoring outcomes ensures your actions are effective and helps refine your approach over time.
Metrics to Track
Incident Reduction
Are reported incidents decreasing after implementing changes?
Employee Engagement
Are workers participating more actively in reporting and training?
Audit Performance
Has compliance improved during inspections or audits?
Example in Action: After a healthcare facility introduced monthly safety meetings and revamped reporting protocols, they saw a 20% reduction in patient-handling injuries within six months. Tracking these metrics highlighted the direct impact of their efforts.
How Technology Enhances the Process
Modern safety management software is an invaluable tool for turning data into actionable insights. Automation and analytics features simplify every step of the process, from data collection to trend analysis.
Key Features to Look For
Real-Time Reporting
Capture incidents and near-misses instantly with mobile tools.
Automated Analytics
Generate reports that highlight patterns and trends without manual effort.
Customizable Dashboards
Visualize data in a way that’s meaningful to your organization’s goals.
Pro Tip: Choose software that integrates seamlessly with existing systems, ensuring all relevant data flows into a single platform.
The Bottom Line: Turn Data Into Action
Incident data is more than a record of past mistakes—it’s a guide to preventing future ones. By collecting consistent data, identifying patterns, and taking strategic action, safety managers can transform raw information into meaningful improvements.
The process doesn’t end with analysis. Sharing insights with your team and monitoring results ensures a cycle of continuous improvement. With the right strategies and tools, your organization can stay ahead of risks, improve compliance, and create a safer workplace for everyone.
Start using your data today—it’s not just numbers; it’s your blueprint for a safer future.
Related Articles
- All Posts
- 360 Immersive
- 360immersive
- accident prevention
- Alberta safety courses
- Allan James Moore
- asking for help
- avoidable injuries
- awareness
- back strain
- BambooHR integration
- biometric sensors
- BIS Podcast
- BIS Safety Software
- black holes
- Brave Leadership
- burnout
- Canadian safety history
- carbon monoxide
- CCOHS
- chemical
- chemical vapors
- chronic injuries
- chronic pain
- Coming Soon
- community safety programs
- Compliance
- compliance courses
- compliance tools
- compliance vs protection
- Construction advocacy
- Construction education
- Construction industry
- construction safety training
- continuous safety improvement
- crane
- customized training
- daily trip inspection
- Danny Sellers
- data-driven safety
- digital forms
- Dr. Joanna Pagonis
- driver file management
- driver training
- early intervention
- EHS
- Einstein
- electrical safety
- emergency preparedness
- emergency response
- emergency supplies
- emotional training
- employee health
- employee safety
- employee training
- ergonomic risks
- ergonomics
- evidence collection
- exoskeletons
- fall protection
- field safety
- field safety services
- fire prevention
- first aid kit
- first week on the job
- first workplace injury
- fleet management
- frontline safety
- gravitational waves
- hand injuries
- hands-on training
- hazard communication
- hazard prevention
- hazard recognition
- Health & Safety Podcast
- hearing loss prevention
- heavy equipment safety
- hidden workplace hazards
- high voltage systems
- HR automation
- HR software
- human-centered safety
- humor in safety
- immersive learning
- Imposter Syndrome
- incident data
- incident investigation
- incident reporting
- industrial safety
- injury consequences
- injury prevention
- injury prevention tips
- injury recovery
- injury reporting
- injury response
- injury response plan
- internal audits
- invisible dangers
- Jennifer Lastra
- job site hazards
- job site risks
- job site safety
- Jody Young
- KBR Safety Training
- labor movement
- ladder safety
- Leadership
- leadership accountability
- leadership and empathy
- learning from incidents
- lifting techniques
- LIGO
- LMS
- lockout tagout
- lone workers
- mental health at work
- MI Safety
- minor injuries
- new workers
- no-blame investigations
- noise exposure
- Northern BC
- NRCA
- NSC Standard 13
- occupational fatigue
- occupational hazards
- occupational health
- occupational safety
- OHSA
- oil and gas safety
- onboarding safety
- Online safety training
- organizational safety
- OSHA compliance
- OSHA standards
- overhead crane courses
- pain awareness
- personal protective equipment
- physics careers
- pipeline safety
- podcast
- post-accident review
- post-incident protocol
- PPE
- PPE enforcement
- PPE improvement
- pre-trip inspection
- pretrip inspection
- proactive safety measures.
- Professional development
- psychological hazards
- psychological safety
- repetitive motion injuries
- respirator safety
- risk management
- risk reduction
- road safety
- Robin Postnikoff
- root cause analysis
- routine task risks
- safe work habits
- safety
- safety accountability
- safety advice
- safety article
- safety awareness
- safety best practices
- safety communication
- safety compliance
- Safety Conversations
- safety culture
- safety engagement
- safety follow-up
- safety gear
- safety habits
- safety innovation
- safety insights
- safety inspection
- Safety Leaders
- safety leadership
- safety legislation
- safety lessons
- safety management
- safety management system
- safety metrics
- safety motivation.
- safety myths
- safety podcast
- safety procedure updates
- safety review process
- safety shortcuts
- Safety Spotlight
- safety systems
- safety technology
- safety theater
- safety tips
- safety training
- safety transparency
- silent dangers
- silica dust
- Sinogap Solutions
- slow-building hazards
- smart helmets
- space science
- supervisor training
- team communication
- teamwork
- Total Recordable Injury Formula
- tough guy mentality
- toxic air
- training
- training courses
- training matrix
- training record management
- transportation
- Trust and Accountability
- unseen workplace threats
- vehicle safety
- veteran advice
- Virtual Reality
- VR safety training
- VR Technology
- wearable technology
- WHMIS
- witness statements
- women in leadership
- work-alone training
- work-related injuries
- worker accountability
- worker advocacy
- worker fatigue
- worker protection
- worker safety
- worker safety habits
- worker trust
- workers' rights
- workforce management
- workforce training
- workplace accidents
- workplace air quality
- workplace best practices
- workplace certification
- Workplace Culture
- workplace hazards
- workplace health
- workplace incident response
- workplace injuries
- workplace injury prevention
- workplace mindset
- workplace risk factors
- workplace risk management
- Workplace safety
- workplace safety culture
- workplace safety rules
- workplace safety tips
- workplace safety training
- workplace stress
- workplace tiredness
- workplace wellness
- WSPS

Too many workers risk injury by refusing help to appear tough. This article explains how asking for help and supporting...

Canada’s safety standards weren’t handed down—they were hard-won. This article explores the rise of workplace safety from the early industrial...

Workplace safety cultures fall into three categories: the good, the bad, and the ugly. Some organizations set the gold standard...


