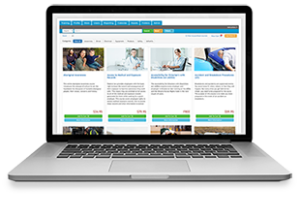
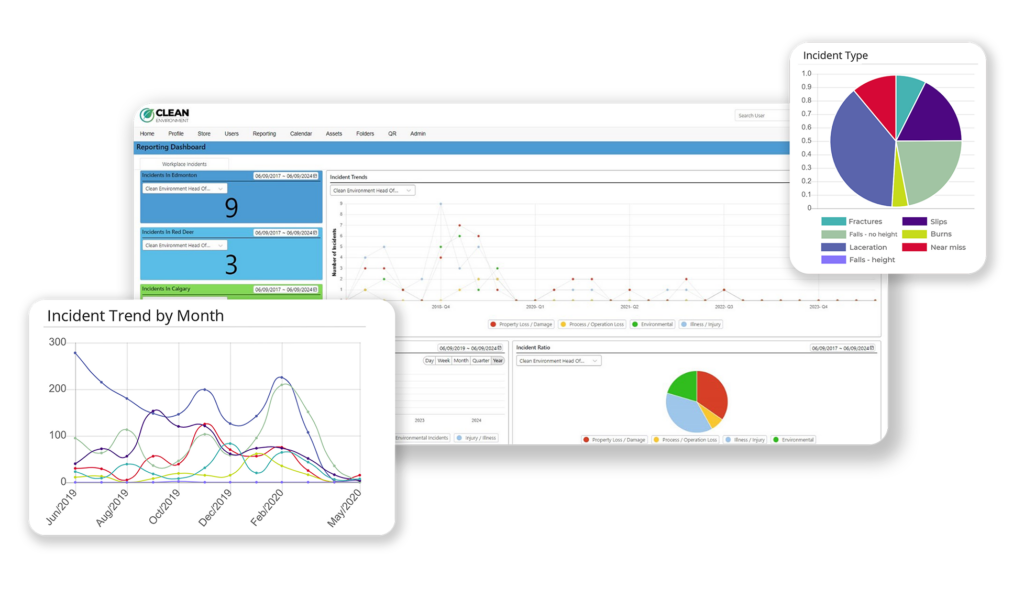
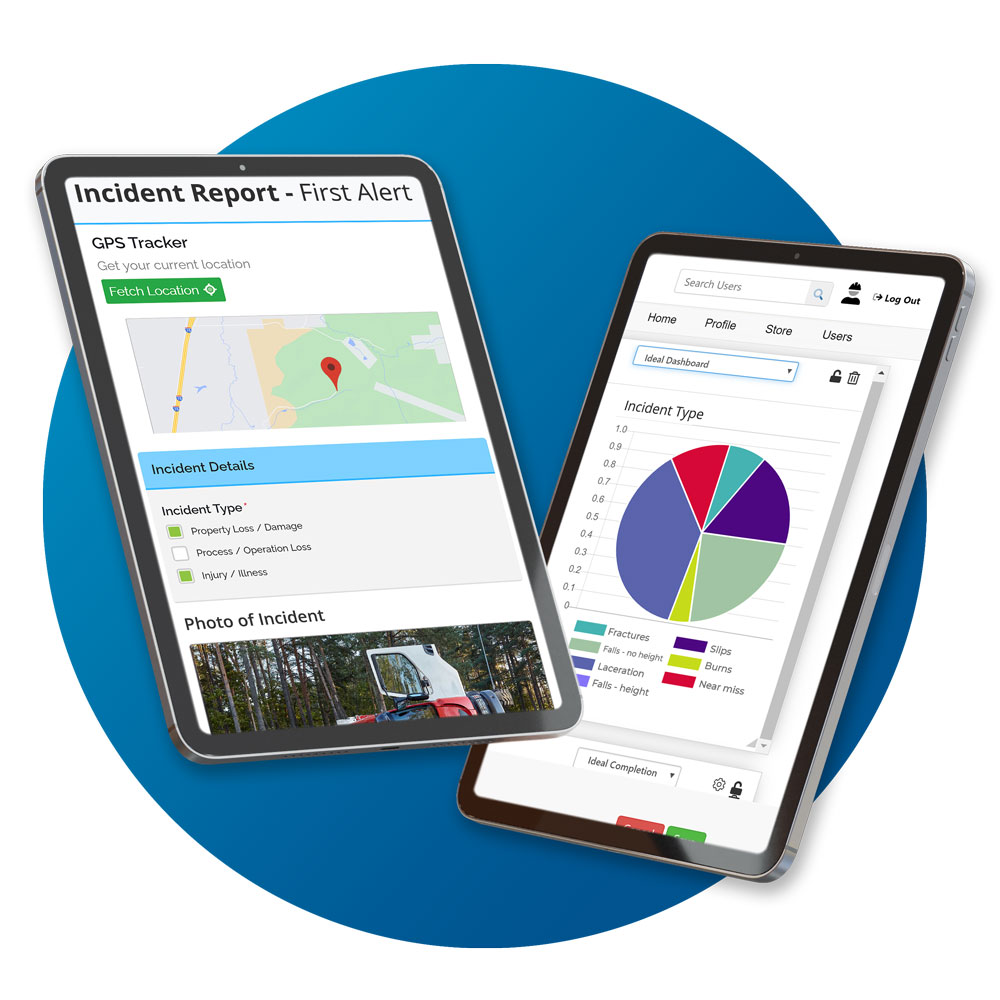
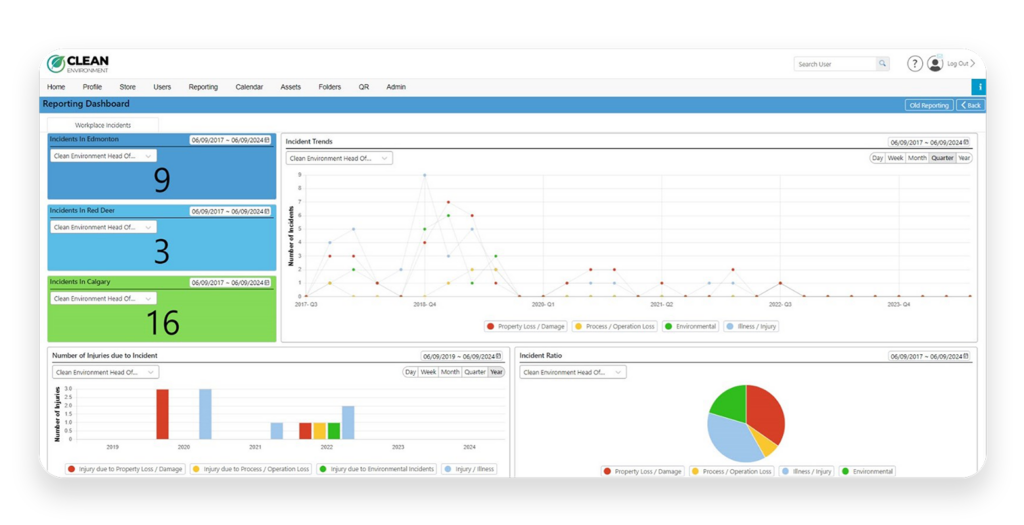
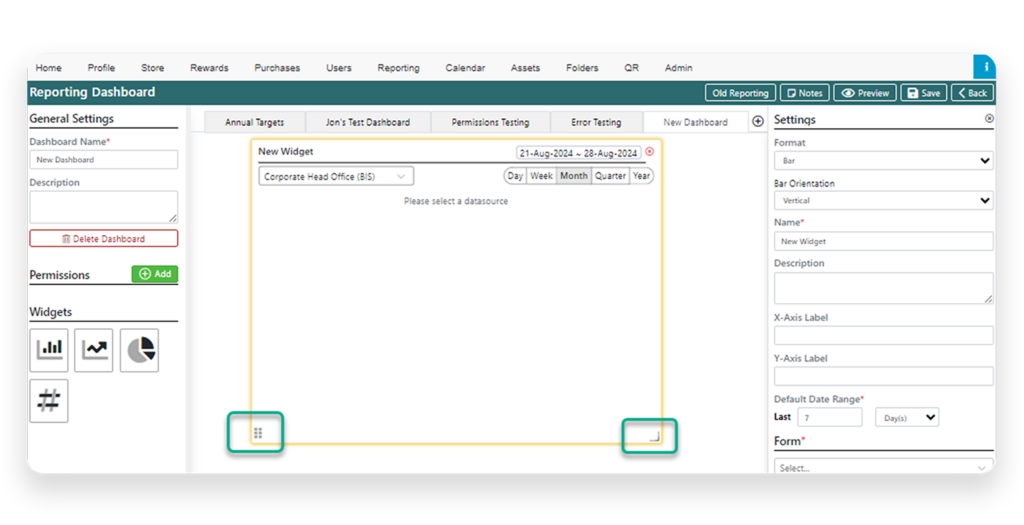
New Reporting Dashboard


“Having worked with BIS trainer software for over a decade I continue to be impressed with the amount of high-quality customer service and support they provide. This has allowed us to expand our service offerings to our clients in a variety of forms and functions.”

Wesley P.
Safety Professional
“The customer service is fantastic – when an urgent need arises, they tackle it immediately. In the past, I have asked some challenging questions to find out if the system can meet our unique business needs and they always pull through with a easy solution.”

Christina W.
OH&S Manager